Heat map of London crime
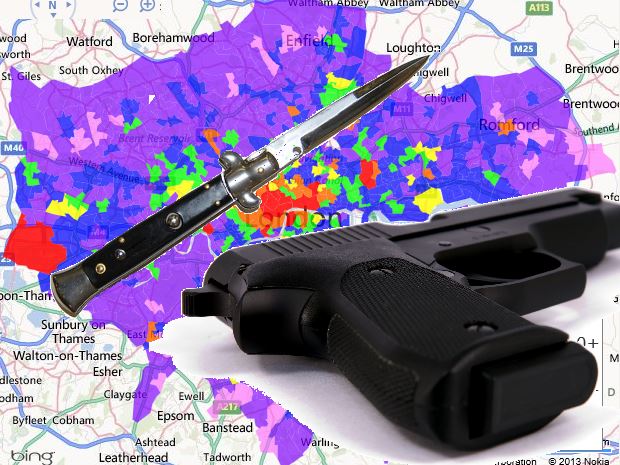
We created a heat map to show the most dangerous areas of London. Is your area hot or cold?
We have spent a lot of time updating our crime statistics in all of England and Wales so that when you search for your ideal neighbourhood you can be certain our crime data is 100% up to date with the latest crime figures from the Home Office.
Since we are certain our data accurately reflects the reported crime rates in England and Wales we have used our statistics to create a heat map of crime in London so you can see which areas are hot or cold for crime. Crime is calculated by crimes reported per 1000 residents over the past year (July 2012 - July 2013).
Hotter colours like red and orange show areas of highest crime and the cooler colours such as the blue, indigo and violet show the areas with lower crime rates.
So lets take a look at the heat map of London crime we created:
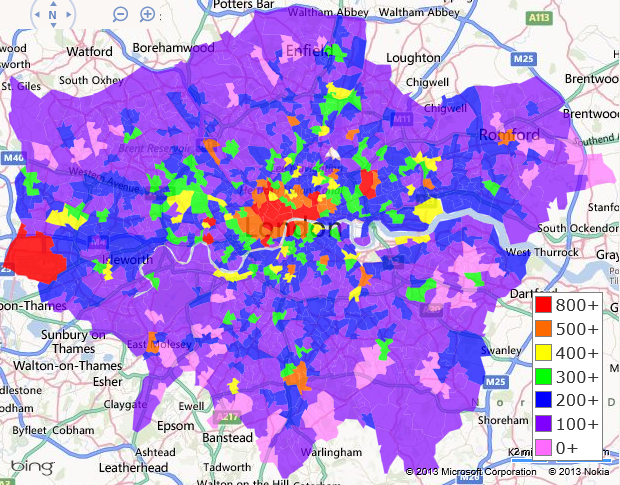
As you can see the crime rates are low in the outer suburbs and gradually rise as we enter the centre of London.
You can see there are very few violet coloured areas representing 0-100 crimes reported in the past year per 1000 residents and these are almost all in the outer suburbs alongside purple representing 100-200 crimes per 1000 residents. Bromley in the south east is all purples and violets.
Areas move through blue (200-300 crimes reported per 1000 residents), green (300-400) and yellow (400-500) as we move towards Central London.
As we draw closer to the real touristy areas of London such as Marylebone, Leicester Square, Regents Park, Bloomsbury, Waterloo.
Some of the red spots just outside of Central may be of interest. The big red area to the east of London is Stratford and New Town in Newham which happens to contain the Olympic Park. Since this data would include the time of the London 2012 Olympics this would explain the higher rate of cases reported here and will most likely be temporary.
Two spots slightly west of Central London are Shepherd's Bush Green which contains the new Westfield Shopping Centre in Hammersmith and Fulham. The other is Hammersmith Broadway which contains Hammersmith Underground and The Broadway Shopping Centre. The giant red spot all the way to the west of London is West Drayton in Hillingdon which is largely made up of Heathrow Airport.
Where are you on London's crime heat map?
Are you feeling hot and bothered or chilled out and cool? London's hot spots for crime are definitely situated more towards the centre of London than the nice crime scarce suburbs. Do you live in the suburbs or the centre? Do you think the suburbs feel a lot safer or maybe you feel Central London isn't as dangerous as it appears?