Property price list of London boroughs
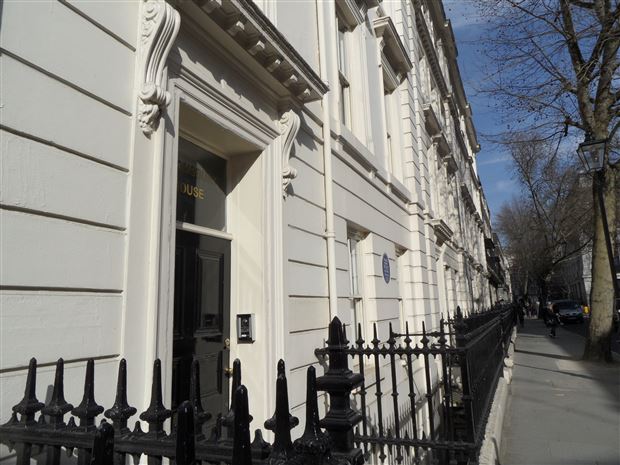
London's most expensive boroughs, London's cheapest boroughs. Where are you on the property price list table?
We took all property sales over the past year of available data (July 2012 - July 2013) and calculated the average property price for each of London's boroughs. With that we created a league table of all of London's 32 boroughs ranked by the average property sale price of the past year.
Let's take a look at the table:
| # | Borough | Average | ||
|---|---|---|---|---|
| 1 | Kensington and Chelsea | £1,445,075 | ||
| 2 | Westminster | £1,132,155 | ||
| 3 | Camden | £788,955 | ||
| 4 | Hammersmith and Fulham | £671,575 | ||
| 5 | Richmond upon Thames | £615,208 | ||
| 6 | Islington | £523,751 | ||
| 7 | Wandsworth | £520,883 | ||
| 8 | Barnet | £485,467 | ||
| 9 | Merton | £430,869 | ||
| 10 | Kingston upon Thames | £420,278 | ||
| 11 | Lambeth | £399,898 | ||
| 12 | Hackney | £390,640 | ||
| 13 | Haringey | £379,527 | ||
| 14 | Ealing | £369,465 | ||
| 15 | Southwark | £367,492 | ||
| 16 | Brent | £357,008 | ||
| 17 | Harrow | £351,899 | ||
| 18 | Tower Hamlets | £345,077 | ||
| 19 | Bromley | £333,376 | ||
| 20 | Hounslow | £328,371 | ||
| 21 | Hillingdon | £290,648 | ||
| 22 | Enfield | £286,222 | ||
| 23 | Redbridge | £283,512 | ||
| 24 | Lewisham | £279,878 | ||
| 25 | Sutton | £275,049 | ||
| 26 | Croydon | £259,005 | ||
| 27 | Waltham Forest | £254,516 | ||
| 28 | Havering | £252,581 | ||
| 29 | Greenwich | £246,315 | ||
| 30 | Bexley | £226,092 | ||
| 31 | Newham | £217,072 | ||
| 32 | Barking and Dagenham | £176,011 | ||
This includes all private property transactions from July 2012 to July 2013 all properties from flats to detached houses.
You can see right at the top of the table we have Kensington and Chelsea and Westminster with average property prices over the past year reaching over £1,000,000!
The table then works its way down to mostly suburbs where property prices aren't quite so scary. Barking and Dagenham is at the bottom with average property prices of £176,000.
Where do you rate in London's property price table?
Let us know where you fall in this average price list of boroughs. Did you get your property for more or less than the average?
