Millfield
Blaby, East Midlands
Interested in a different area?
Enter a postcode or location
£380,000 3 bed detached house for sale in Lubbesthorpe Road
Lubbesthorpe Road, Leicester LE3
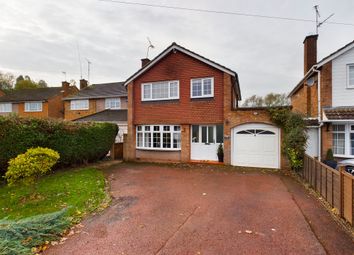
£400,000 4 bed detached house for sale in Castleford Road
Castleford Road, Braunstone, Leicester LE3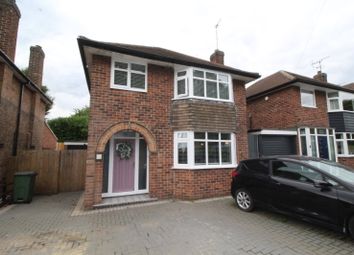
£360,000 3 bed detached house for sale in Kingsway
Kingsway, Leicester, Leicestershire LE3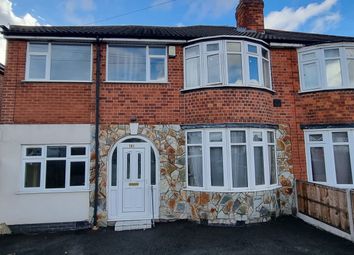
£350,000 4 bed semi detached house for sale in Narborough Road South
Narborough Road South, Braunstone, Leicester LE3
£219pw 3 bed link detached house to let in 17 Hillrise Avenue
17 Hillrise Avenue, Leicester LE3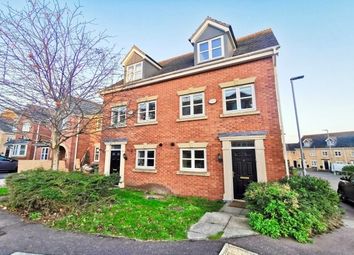
£231pw 3 bed to let in Shipman Road
Shipman Road, Leicester LE3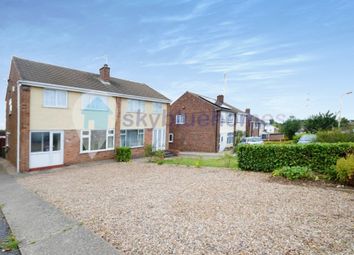
£242pw 3 bed semi detached house to let in Millfield Crescent
Millfield Crescent, Leicester LE3
£225pw 3 bed to let in Hillrise Avenue
Hillrise Avenue, Braunstone, Leicester LE3Property Prices in Millfield
| Property sales over past 3 months | Millfield | East Midlands | England and Wales | |
|---|---|---|---|---|
| £ | +/- | £ | £ | |
| All | £208k | £219k | £332k | |
| Flats | £110k | £113k | £210k | |
| Terraced | £217k | £181k | £272k | |
| Semi detached | £199k | £296k | £423k | |
| Detached | £174k | £151k | £262k | |
Crimes from past year in Millfield
| Crime reported | Millfield | East Midlands | England and Wales | |
|---|---|---|---|---|
| per 1000 | +/- | per 1000 | per 1000 | |
| All crime | 73 | -36 | 109 | 112 |
| Violence & sexual offences | 8 | -18 | 26 | 23 |
| Robbery & theft | 12 | -11 | 23 | 25 |
| Burglary | 6 | -3 | 9 | 9 |
| Drugs | 0 | -2 | 2 | 2 |
| Vandalism | 1 | -2 | 3 | 5 |
| Vehicle | 12 | 5 | 7 | 8 |
| Antisocial behaviour | 8 | 1 | 7 | 7 |
| Other | 23 | -6 | 29 | 31 |
Schools results in Millfield
| Level achieved | Blaby | East Midlands | England and Wales | |
|---|---|---|---|---|
| % | +/- | % | % | |
| KS2 Maths Level 4+ | 83% | 81% | 81% | |
| KS2 English Level 4+ | 86% | 81% | 82% | |
| 5+ A*-C GCSEs | 82% | 80% | 80% | |
| 2+ A Levels | 94% | 93% | 94% | |
Age of residents in Millfield
| Age group | Millfield | East Midlands | England and Wales | |
|---|---|---|---|---|
| % | +/- | % | % | |
| 0-17 | 21% | 21% | 21% | |
| 18-29 | 15% | 16% | 16% | |
| 30-44 | 20% | 20% | 20% | |
| 45-59 | 20% | 20% | 20% | |
| 60+ | 24% | 23% | 23% | |
Living arrangements of residents in Millfield
| Living arrangement of household | Millfield | East Midlands | England and Wales | |
|---|---|---|---|---|
| % | +/- | % | % | |
| Couple with children | 22% | 21% | 21% | |
| Couple without children | 38% | 37% | 34% | |
| Single parent | 12% | 11% | 12% | |
| One person | 27% | 29% | 30% | |
| Many people | 2% | 3% | 3% | |
Marital statuses in Millfield
| Marital status of residents | Millfield | East Midlands | England and Wales | |
|---|---|---|---|---|
| % | +/- | % | % | |
| Single | 30% | 32% | 34% | |
| Married | 52% | 49% | 47% | |
| Divorced Separated Widowed | 18% | 19% | 19% | |
Occupations of working residents in Millfield aged between 16 and 74
| Occupation | Millfield | East Midlands | England and Wales | |
|---|---|---|---|---|
| % | +/- | % | % | |
| Managers and Directors | 8% | 11% | 11% | |
| All Professionals | 23% | 27% | 29% | |
| Administrative | 12% | 11% | 11% | |
| Skilled Trade | 13% | 12% | 12% | |
| Care, Leisure and Sales | 21% | 18% | 18% | |
| Routine and Elementary | 24% | 22% | 19% | |
Religions of residents in Millfield
| Religion | Millfield | East Midlands | England and Wales | |
|---|---|---|---|---|
| % | +/- | % | % | |
| Christian | 51% | 63% | 64% | |
| Hindu | 9% | 2% | 1% | |
| Jewish | 0% | 0% | 0% | |
| Muslim | 3% | 3% | 5% | |
| Sikh | 10% | 1% | 1% | |
| Other | 1% | 1% | 1% | |
| No religion | 27% | 30% | 28% | |
Other statistics about Millfield
| Statistic | Millfield | East Midlands | England and Wales | |
|---|---|---|---|---|
| +/- | ||||
| Annual household income | £27k | £31k | £34k | |
| Domestic gardens | 36% | 3% | 19% | |
| Green spaces | 31% | 90% | 51% | |