Belgrave
Tamworth, West Midlands
Interested in a different area?
Enter a postcode or location
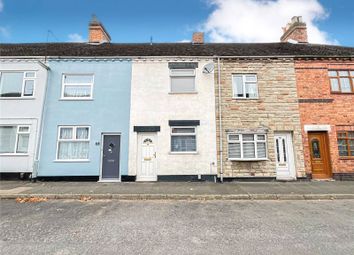
£165,000 2 bed terraced house for sale in East View
East View, Tamworth, Staffordshire B77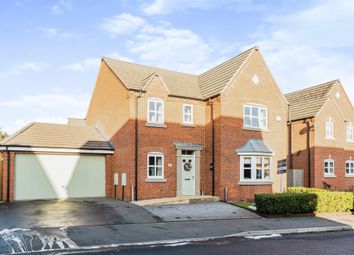
£450,000 4 bed detached house for sale in Croft Close
Croft Close, Two Gates, Tamworth B77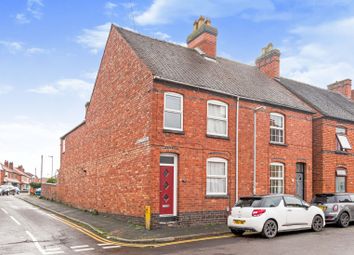
£210,000 3 bed end terrace house for sale in East View
East View, Tamworth B77
£240,000 4 bed semi detached house for sale in Wolseley
Wolseley, Glascote, Tamworth B77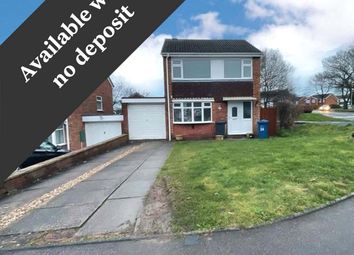
£288pw 3 bed detached house to let in Jensen
Jensen, Tamworth, Staffordshire B77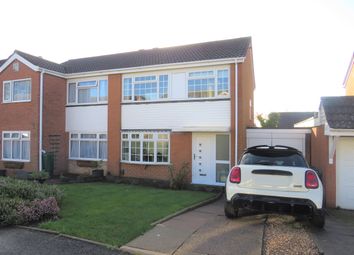
£230pw 3 bed semi detached house to let in Lotus
Lotus, Glascote, Tamworth B77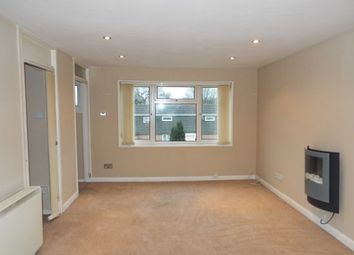
£156pw 1 bed flat to let in Honeybourne
Honeybourne, Tamworth B77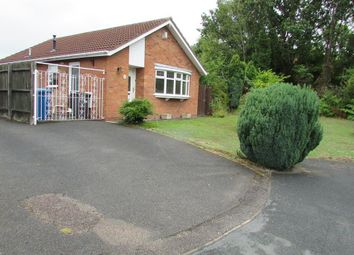
£208pw 2 bed detached bungalow to let in Cringlebrook
Cringlebrook, Tamworth B77Property Prices in Belgrave
| Property sales over past 3 months | Belgrave | West Midlands | England and Wales | |
|---|---|---|---|---|
| £ | +/- | £ | £ | |
| All | £177k | £215k | £332k | |
| Flats | £67k | £125k | £210k | |
| Terraced | £178k | £200k | £272k | |
| Semi detached | £192k | £322k | £423k | |
| Detached | £145k | £163k | £262k | |
Crimes from past year in Belgrave
| Crime reported | Belgrave | West Midlands | England and Wales | |
|---|---|---|---|---|
| per 1000 | +/- | per 1000 | per 1000 | |
| All crime | 76 | -31 | 107 | 112 |
| Violence & sexual offences | 18 | -5 | 23 | 23 |
| Robbery & theft | 9 | -11 | 20 | 25 |
| Burglary | 7 | -1 | 8 | 9 |
| Drugs | 0 | -1 | 1 | 2 |
| Vandalism | 2 | -1 | 3 | 5 |
| Vehicle | 8 | -1 | 9 | 8 |
| Antisocial behaviour | 3 | -5 | 8 | 7 |
| Other | 25 | -5 | 30 | 31 |
Schools results in Belgrave
| Level achieved | Tamworth | West Midlands | England and Wales | |
|---|---|---|---|---|
| % | +/- | % | % | |
| KS2 Maths Level 4+ | 75% | 80% | 81% | |
| KS2 English Level 4+ | 76% | 81% | 82% | |
| 5+ A*-C GCSEs | 80% | 83% | 80% | |
| 2+ A Levels | 96% | 93% | 94% | |
Age of residents in Belgrave
| Age group | Belgrave | West Midlands | England and Wales | |
|---|---|---|---|---|
| % | +/- | % | % | |
| 0-17 | 24% | 22% | 21% | |
| 18-29 | 16% | 16% | 16% | |
| 30-44 | 21% | 20% | 20% | |
| 45-59 | 19% | 19% | 20% | |
| 60+ | 20% | 23% | 23% | |
Living arrangements of residents in Belgrave
| Living arrangement of household | Belgrave | West Midlands | England and Wales | |
|---|---|---|---|---|
| % | +/- | % | % | |
| Couple with children | 22% | 21% | 21% | |
| Couple without children | 35% | 34% | 34% | |
| Single parent | 15% | 12% | 12% | |
| One person | 25% | 30% | 30% | |
| Many people | 2% | 3% | 3% | |
Marital statuses in Belgrave
| Marital status of residents | Belgrave | West Midlands | England and Wales | |
|---|---|---|---|---|
| % | +/- | % | % | |
| Single | 34% | 34% | 34% | |
| Married | 46% | 48% | 47% | |
| Divorced Separated Widowed | 20% | 19% | 19% | |
Occupations of working residents in Belgrave aged between 16 and 74
| Occupation | Belgrave | West Midlands | England and Wales | |
|---|---|---|---|---|
| % | +/- | % | % | |
| Managers and Directors | 7% | 10% | 11% | |
| All Professionals | 17% | 27% | 29% | |
| Administrative | 11% | 11% | 11% | |
| Skilled Trade | 13% | 12% | 12% | |
| Care, Leisure and Sales | 20% | 18% | 18% | |
| Routine and Elementary | 32% | 21% | 19% | |
Religions of residents in Belgrave
| Religion | Belgrave | West Midlands | England and Wales | |
|---|---|---|---|---|
| % | +/- | % | % | |
| Christian | 64% | 64% | 64% | |
| Hindu | 0% | 1% | 1% | |
| Jewish | 0% | 0% | 0% | |
| Muslim | 0% | 7% | 5% | |
| Sikh | 0% | 3% | 1% | |
| Other | 1% | 1% | 1% | |
| No religion | 35% | 24% | 28% | |
Other statistics about Belgrave
| Statistic | Belgrave | West Midlands | England and Wales | |
|---|---|---|---|---|
| +/- | ||||
| Annual household income | £30k | £31k | £34k | |
| Domestic gardens | 33% | 5% | 19% | |
| Green spaces | 30% | 88% | 51% | |