East Tilbury
Thurrock, East of England
Interested in a different area?
Enter a postcode or location
£450,000 4 bed semi detached house for sale in Sandy Lane
Sandy Lane, Chadwell St.Mary RM16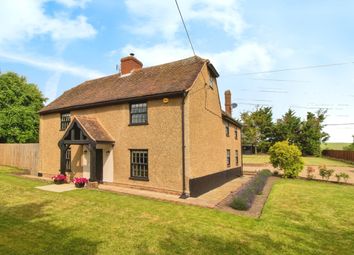
£925,000 5 bed farmhouse for sale in Waltons Hall Road
Waltons Hall Road, Linford SS17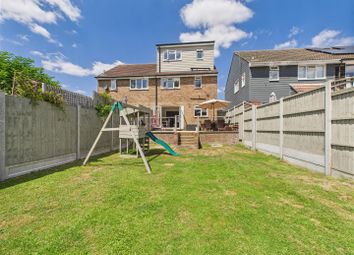
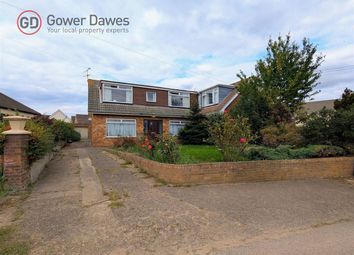
£475,000 4 bed semi detached house for sale in Lower Crescent
Lower Crescent, Linford, Stanford-Le-Hope SS17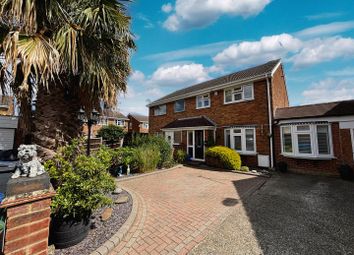
£400,000 4 bed semi detached house for sale in Brindles Close
Brindles Close, Linford, Stanford-Le-Hope SS17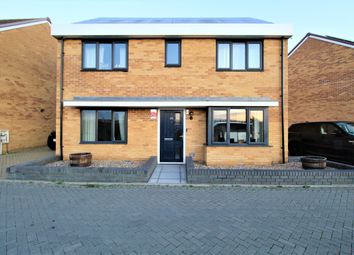
£865pw 4 bed detached house to let in Pintail Close
Pintail Close, East Tilbury, Tilbury RM18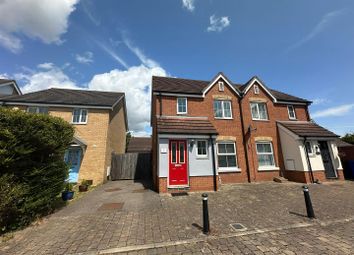
£426pw 3 bed semi detached house to let in Hill House Drive
Hill House Drive, Chadwell St Mary RM16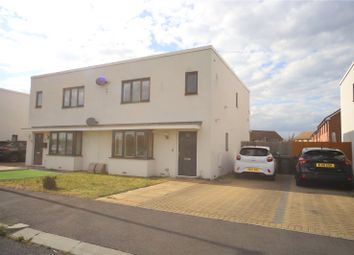
£426pw 3 bed semi detached house to let in Shearwater Avenue
Shearwater Avenue, East Tilbury, Essex RM18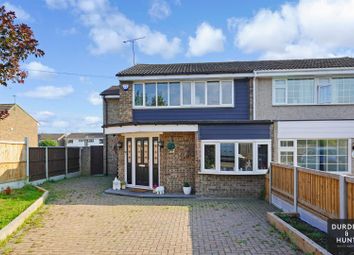
£600pw 4 bed end terrace house to let in Solway
Solway, East Tilbury, Tilbury RM18Property Prices in East Tilbury
| Property sales over past 3 months | East Tilbury | East of England | England and Wales | |
|---|---|---|---|---|
| £ | +/- | £ | £ | |
| All | £292k | £364k | £332k | |
| Flats | £131k | £189k | £210k | |
| Terraced | £295k | £321k | £272k | |
| Semi detached | £230k | £480k | £423k | |
| Detached | £358k | £272k | £262k | |
Crimes from past year in East Tilbury
| Crime reported | East Tilbury | East of England | England and Wales | |
|---|---|---|---|---|
| per 1000 | +/- | per 1000 | per 1000 | |
| All crime | 94 | -11 | 105 | 112 |
| Violence & sexual offences | 21 | 0 | 21 | 23 |
| Robbery & theft | 13 | -10 | 23 | 25 |
| Burglary | 7 | -1 | 8 | 9 |
| Drugs | 1 | -1 | 2 | 2 |
| Vandalism | 0 | -4 | 4 | 5 |
| Vehicle | 7 | 0 | 7 | 8 |
| Antisocial behaviour | 7 | 1 | 6 | 7 |
| Other | 34 | 4 | 30 | 31 |
Schools results in East Tilbury
| Level achieved | Thurrock | East of England | England and Wales | |
|---|---|---|---|---|
| % | +/- | % | % | |
| KS2 Maths Level 4+ | 79% | 79% | 81% | |
| KS2 English Level 4+ | 79% | 80% | 82% | |
| 5+ A*-C GCSEs | 84% | 78% | 80% | |
| 2+ A Levels | 97% | 95% | 94% | |
Age of residents in East Tilbury
| Age group | East Tilbury | East of England | England and Wales | |
|---|---|---|---|---|
| % | +/- | % | % | |
| 0-17 | 24% | 22% | 21% | |
| 18-29 | 16% | 15% | 16% | |
| 30-44 | 22% | 20% | 20% | |
| 45-59 | 21% | 20% | 20% | |
| 60+ | 17% | 24% | 23% | |
Living arrangements of residents in East Tilbury
| Living arrangement of household | East Tilbury | East of England | England and Wales | |
|---|---|---|---|---|
| % | +/- | % | % | |
| Couple with children | 26% | 22% | 21% | |
| Couple without children | 37% | 37% | 34% | |
| Single parent | 13% | 10% | 12% | |
| One person | 22% | 28% | 30% | |
| Many people | 2% | 3% | 3% | |
Marital statuses in East Tilbury
| Marital status of residents | East Tilbury | East of England | England and Wales | |
|---|---|---|---|---|
| % | +/- | % | % | |
| Single | 34% | 31% | 34% | |
| Married | 50% | 50% | 47% | |
| Divorced Separated Widowed | 16% | 19% | 19% | |
Occupations of working residents in East Tilbury aged between 16 and 74
| Occupation | East Tilbury | East of England | England and Wales | |
|---|---|---|---|---|
| % | +/- | % | % | |
| Managers and Directors | 9% | 11% | 11% | |
| All Professionals | 19% | 30% | 29% | |
| Administrative | 15% | 12% | 11% | |
| Skilled Trade | 13% | 12% | 12% | |
| Care, Leisure and Sales | 19% | 17% | 18% | |
| Routine and Elementary | 25% | 18% | 19% | |
Religions of residents in East Tilbury
| Religion | East Tilbury | East of England | England and Wales | |
|---|---|---|---|---|
| % | +/- | % | % | |
| Christian | 68% | 64% | 64% | |
| Hindu | 0% | 1% | 1% | |
| Jewish | 0% | 1% | 0% | |
| Muslim | 1% | 3% | 5% | |
| Sikh | 0% | 0% | 1% | |
| Other | 0% | 1% | 1% | |
| No religion | 31% | 30% | 28% | |
Other statistics about East Tilbury
| Statistic | East Tilbury | East of England | England and Wales | |
|---|---|---|---|---|
| +/- | ||||
| Annual household income | £35k | £36k | £34k | |
| Domestic gardens | 3% | 4% | 19% | |
| Green spaces | 78% | 88% | 51% | |