Englefield Green East
Runnymede, South East
Interested in a different area?
Enter a postcode or location
£1,800,000 7 bed detached house for sale in Hollycombe
Hollycombe, Englefield Green TW20
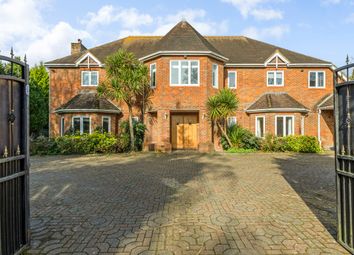
£4,695,000 5 bed detached house for sale in Coopers Hill Lane
Coopers Hill Lane, Egham TW20
£3,500,000 4 bed detached house for sale in Magna Carta Park
Magna Carta Park, Englefield Green TW20
£2,000,000 3 bed semi detached house for sale in The Barons
The Barons, Berkshire, Egham TW20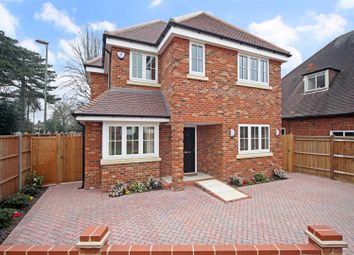
£1,153pw 6 bed detached house to let in Willow Walk
Willow Walk, Englefield Green, Surrey TW20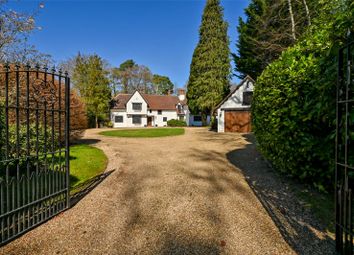
£2,826pw 5 bed detached house to let in Ridgemead Road
Ridgemead Road, Englefield Green, Egham, Surrey TW20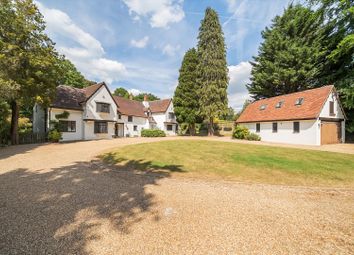
£2,826pw 5 bed detached house to let in Ridgemead Road
Ridgemead Road, Englefield Green, Egham, Surrey TW20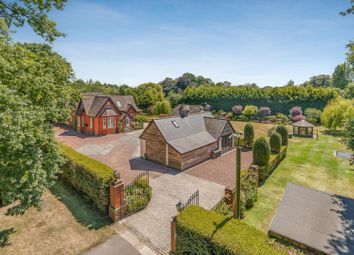
£2,538pw 5 bed detached house to let in Bishopsgate Road
Bishopsgate Road, Englefield Green, Surrey TW20Property Prices in Englefield Green East
| Property sales over past 3 months | Englefield Green East | South East | England and Wales | |
|---|---|---|---|---|
| £ | +/- | £ | £ | |
| All | £370k | £442k | £332k | |
| Flats | £230k | £211k | £210k | |
| Terraced | £416k | £360k | £272k | |
| Semi detached | £3,162k | £595k | £423k | |
| Detached | £347k | £304k | £262k | |
Crimes from past year in Englefield Green East
| Crime reported | Englefield Green East | South East | England and Wales | |
|---|---|---|---|---|
| per 1000 | +/- | per 1000 | per 1000 | |
| All crime | 73 | -10 | 83 | 112 |
| Violence & sexual offences | 18 | 5 | 13 | 23 |
| Robbery & theft | 14 | -6 | 20 | 25 |
| Burglary | 7 | -1 | 8 | 9 |
| Drugs | 2 | 0 | 2 | 2 |
| Vandalism | 2 | -1 | 3 | 5 |
| Vehicle | 4 | -1 | 5 | 8 |
| Antisocial behaviour | 4 | 0 | 4 | 7 |
| Other | 19 | -6 | 25 | 31 |
Schools results in Englefield Green East
| Level achieved | Runnymede | South East | England and Wales | |
|---|---|---|---|---|
| % | +/- | % | % | |
| KS2 Maths Level 4+ | 85% | 80% | 81% | |
| KS2 English Level 4+ | 85% | 82% | 82% | |
| 5+ A*-C GCSEs | 80% | 79% | 80% | |
| 2+ A Levels | 92% | 94% | 94% | |
Age of residents in Englefield Green East
| Age group | Englefield Green East | South East | England and Wales | |
|---|---|---|---|---|
| % | +/- | % | % | |
| 0-17 | 15% | 22% | 21% | |
| 18-29 | 42% | 15% | 16% | |
| 30-44 | 14% | 20% | 20% | |
| 45-59 | 13% | 20% | 20% | |
| 60+ | 16% | 23% | 23% | |
Living arrangements of residents in Englefield Green East
| Living arrangement of household | Englefield Green East | South East | England and Wales | |
|---|---|---|---|---|
| % | +/- | % | % | |
| Couple with children | 20% | 22% | 21% | |
| Couple without children | 28% | 36% | 34% | |
| Single parent | 7% | 10% | 12% | |
| One person | 31% | 29% | 30% | |
| Many people | 14% | 3% | 3% | |
Marital statuses in Englefield Green East
| Marital status of residents | Englefield Green East | South East | England and Wales | |
|---|---|---|---|---|
| % | +/- | % | % | |
| Single | 58% | 32% | 34% | |
| Married | 31% | 50% | 47% | |
| Divorced Separated Widowed | 11% | 19% | 19% | |
Occupations of working residents in Englefield Green East aged between 16 and 74
| Occupation | Englefield Green East | South East | England and Wales | |
|---|---|---|---|---|
| % | +/- | % | % | |
| Managers and Directors | 14% | 12% | 11% | |
| All Professionals | 34% | 33% | 29% | |
| Administrative | 10% | 12% | 11% | |
| Skilled Trade | 6% | 11% | 12% | |
| Care, Leisure and Sales | 19% | 17% | 18% | |
| Routine and Elementary | 16% | 15% | 19% | |
Religions of residents in Englefield Green East
| Religion | Englefield Green East | South East | England and Wales | |
|---|---|---|---|---|
| % | +/- | % | % | |
| Christian | 57% | 65% | 64% | |
| Hindu | 2% | 1% | 1% | |
| Jewish | 1% | 0% | 0% | |
| Muslim | 4% | 3% | 5% | |
| Sikh | 1% | 1% | 1% | |
| Other | 2% | 1% | 1% | |
| No religion | 33% | 30% | 28% | |
Other statistics about Englefield Green East
| Statistic | Englefield Green East | South East | England and Wales | |
|---|---|---|---|---|
| +/- | ||||
| Annual household income | £33k | £41k | £34k | |
| Domestic gardens | 15% | 6% | 19% | |
| Green spaces | 71% | 85% | 51% | |