Fleet Central
Hart, South East
Interested in a different area?
Enter a postcode or location
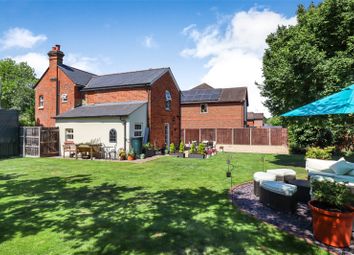
£750,000 4 bed detached house for sale in Connaught Road
Connaught Road, Fleet, Hampshire GU51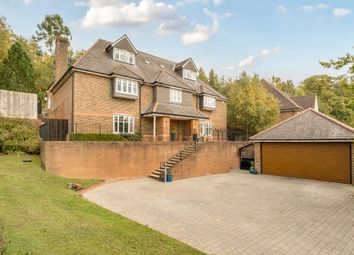
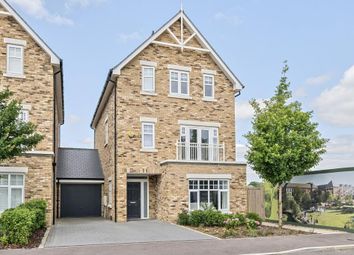
£1,485,000 5 bed detached house for sale in Ibworth Lane
Ibworth Lane, Fleet GU51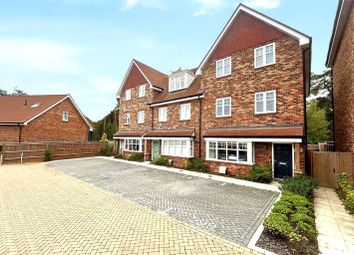
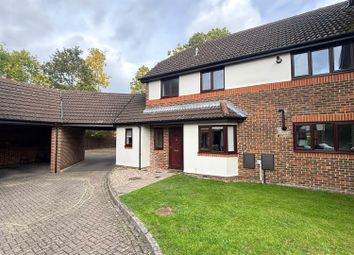
£780,000 4 bed end terrace house for sale in Sweet Chestnut Close
Sweet Chestnut Close, Fleet, Hampshire GU51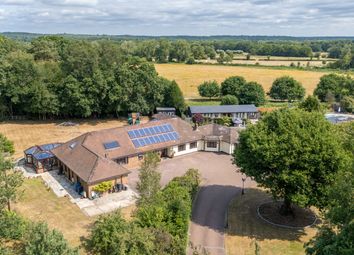
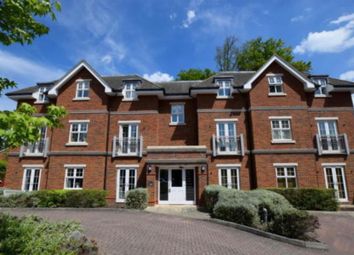
£1,500,000 6 bed detached house for sale in Cove Road
Cove Road, Fleet, Hampshire GU51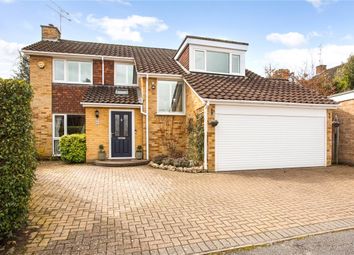
Property Prices in Fleet Central
| Property sales over past 3 months | Fleet Central | South East | England and Wales | |
|---|---|---|---|---|
| £ | +/- | £ | £ | |
| All | £333k | £442k | £332k | |
| Flats | £258k | £211k | £210k | |
| Terraced | £460k | £360k | £272k | |
| Semi detached | £439k | £595k | £423k | |
| Detached | £300k | £304k | £262k | |
Crimes from past year in Fleet Central
| Crime reported | Fleet Central | South East | England and Wales | |
|---|---|---|---|---|
| per 1000 | +/- | per 1000 | per 1000 | |
| All crime | 98 | 15 | 83 | 112 |
| Violence & sexual offences | 3 | -10 | 13 | 23 |
| Robbery & theft | 41 | 21 | 20 | 25 |
| Burglary | 7 | -1 | 8 | 9 |
| Drugs | 1 | -1 | 2 | 2 |
| Vandalism | 7 | 4 | 3 | 5 |
| Vehicle | 4 | -1 | 5 | 8 |
| Antisocial behaviour | 4 | 0 | 4 | 7 |
| Other | 27 | 2 | 25 | 31 |
Schools results in Fleet Central
| Level achieved | Hart | South East | England and Wales | |
|---|---|---|---|---|
| % | +/- | % | % | |
| KS2 Maths Level 4+ | 88% | 80% | 81% | |
| KS2 English Level 4+ | 90% | 82% | 82% | |
| 5+ A*-C GCSEs | 83% | 79% | 80% | |
| 2+ A Levels | 96% | 94% | 94% | |
Age of residents in Fleet Central
| Age group | Fleet Central | South East | England and Wales | |
|---|---|---|---|---|
| % | +/- | % | % | |
| 0-17 | 25% | 22% | 21% | |
| 18-29 | 13% | 15% | 16% | |
| 30-44 | 30% | 20% | 20% | |
| 45-59 | 17% | 20% | 20% | |
| 60+ | 15% | 23% | 23% | |
Living arrangements of residents in Fleet Central
| Living arrangement of household | Fleet Central | South East | England and Wales | |
|---|---|---|---|---|
| % | +/- | % | % | |
| Couple with children | 31% | 22% | 21% | |
| Couple without children | 32% | 36% | 34% | |
| Single parent | 7% | 10% | 12% | |
| One person | 27% | 29% | 30% | |
| Many people | 4% | 3% | 3% | |
Marital statuses in Fleet Central
| Marital status of residents | Fleet Central | South East | England and Wales | |
|---|---|---|---|---|
| % | +/- | % | % | |
| Single | 31% | 32% | 34% | |
| Married | 53% | 50% | 47% | |
| Divorced Separated Widowed | 17% | 19% | 19% | |
Occupations of working residents in Fleet Central aged between 16 and 74
| Occupation | Fleet Central | South East | England and Wales | |
|---|---|---|---|---|
| % | +/- | % | % | |
| Managers and Directors | 17% | 12% | 11% | |
| All Professionals | 46% | 33% | 29% | |
| Administrative | 11% | 12% | 11% | |
| Skilled Trade | 7% | 11% | 12% | |
| Care, Leisure and Sales | 11% | 17% | 18% | |
| Routine and Elementary | 8% | 15% | 19% | |
Religions of residents in Fleet Central
| Religion | Fleet Central | South East | England and Wales | |
|---|---|---|---|---|
| % | +/- | % | % | |
| Christian | 63% | 65% | 64% | |
| Hindu | 3% | 1% | 1% | |
| Jewish | 0% | 0% | 0% | |
| Muslim | 1% | 3% | 5% | |
| Sikh | 0% | 1% | 1% | |
| Other | 1% | 1% | 1% | |
| No religion | 30% | 30% | 28% | |
Other statistics about Fleet Central
| Statistic | Fleet Central | South East | England and Wales | |
|---|---|---|---|---|
| +/- | ||||
| Annual household income | £59k | £41k | £34k | |
| Domestic gardens | 14% | 6% | 19% | |
| Green spaces | 64% | 85% | 51% | |