Thornley
County Durham, North East
Interested in a different area?
Enter a postcode or location
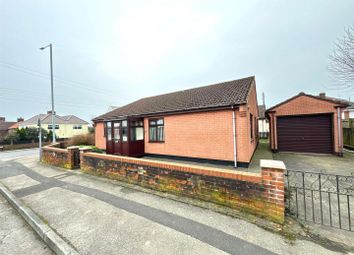
£175,000 4 bed bungalow for sale in Dunelm Road
Dunelm Road, Thornley DH6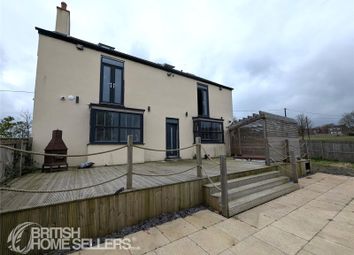
£400,000 5 bed detached house for sale in Gowland Terrace
Gowland Terrace, Wheatley Hill, Durham DH6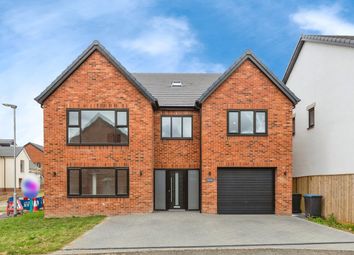
£500,000 6 bed detached house for sale in Dunelm Stables
Dunelm Stables, Thornley, Durham DH6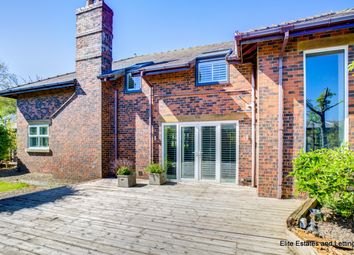
£490,000 4 bed semi detached house for sale in The Old Hospital
The Old Hospital, Bankdam Farm DH6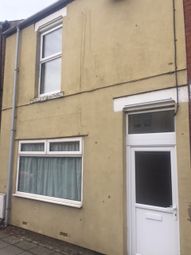
£92pw 3 bed terraced house to let in 12 Alexandra Terrace
12 Alexandra Terrace, Wheatley Hill DH6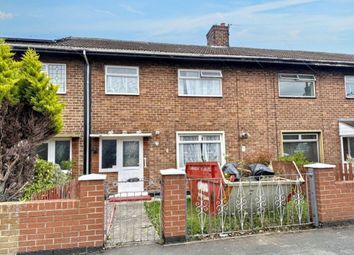
£155pw 3 bed terraced house to let in Johnson Estate
Johnson Estate, Wheatley Hill, Durham, County Durham DH6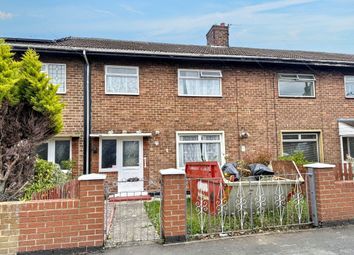
£155pw 3 bed terraced house to let in Johnson Estate
Johnson Estate, Wheatley Hill, Durham DH6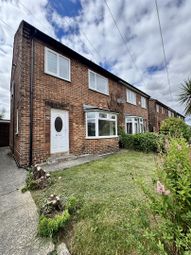
£183pw 3 bed to let in Johnson Estate
Johnson Estate, Wheatley Hill DH6Property Prices in Thornley
| Property sales over past 3 months | Thornley | North East | England and Wales | |
|---|---|---|---|---|
| £ | +/- | £ | £ | |
| All | £61k | £148k | £332k | |
| Flats | - | £100k | £210k | |
| Terraced | £64k | £137k | £272k | |
| Semi detached | £140k | £258k | £423k | |
| Detached | £41k | £108k | £262k | |
Crimes from past year in Thornley
| Crime reported | Thornley | North East | England and Wales | |
|---|---|---|---|---|
| per 1000 | +/- | per 1000 | per 1000 | |
| All crime | 153 | 2 | 151 | 112 |
| Violence & sexual offences | 34 | -3 | 37 | 23 |
| Robbery & theft | 24 | -13 | 37 | 25 |
| Burglary | 23 | 8 | 15 | 9 |
| Drugs | 1 | -1 | 2 | 2 |
| Vandalism | 0 | -3 | 3 | 5 |
| Vehicle | 5 | -1 | 6 | 8 |
| Antisocial behaviour | 11 | 4 | 7 | 7 |
| Other | 51 | 11 | 40 | 31 |
Schools results in Thornley
| Level achieved | County Durham | North East | England and Wales | |
|---|---|---|---|---|
| % | +/- | % | % | |
| KS2 Maths Level 4+ | 82% | 81% | 81% | |
| KS2 English Level 4+ | 82% | 81% | 82% | |
| 5+ A*-C GCSEs | 89% | 85% | 80% | |
| 2+ A Levels | 92% | 93% | 94% | |
Age of residents in Thornley
| Age group | Thornley | North East | England and Wales | |
|---|---|---|---|---|
| % | +/- | % | % | |
| 0-17 | 20% | 20% | 21% | |
| 18-29 | 15% | 16% | 16% | |
| 30-44 | 20% | 19% | 20% | |
| 45-59 | 19% | 21% | 20% | |
| 60+ | 26% | 24% | 23% | |
Living arrangements of residents in Thornley
| Living arrangement of household | Thornley | North East | England and Wales | |
|---|---|---|---|---|
| % | +/- | % | % | |
| Couple with children | 18% | 19% | 21% | |
| Couple without children | 35% | 34% | 34% | |
| Single parent | 13% | 13% | 12% | |
| One person | 32% | 32% | 30% | |
| Many people | 1% | 3% | 3% | |
Marital statuses in Thornley
| Marital status of residents | Thornley | North East | England and Wales | |
|---|---|---|---|---|
| % | +/- | % | % | |
| Single | 32% | 34% | 34% | |
| Married | 47% | 46% | 47% | |
| Divorced Separated Widowed | 21% | 20% | 19% | |
Occupations of working residents in Thornley aged between 16 and 74
| Occupation | Thornley | North East | England and Wales | |
|---|---|---|---|---|
| % | +/- | % | % | |
| Managers and Directors | 7% | 9% | 11% | |
| All Professionals | 21% | 26% | 29% | |
| Administrative | 11% | 12% | 11% | |
| Skilled Trade | 14% | 12% | 12% | |
| Care, Leisure and Sales | 21% | 21% | 18% | |
| Routine and Elementary | 26% | 21% | 19% | |
Religions of residents in Thornley
| Religion | Thornley | North East | England and Wales | |
|---|---|---|---|---|
| % | +/- | % | % | |
| Christian | 80% | 72% | 64% | |
| Hindu | 0% | 0% | 1% | |
| Jewish | 0% | 0% | 0% | |
| Muslim | 0% | 2% | 5% | |
| Sikh | 0% | 0% | 1% | |
| Other | 1% | 1% | 1% | |
| No religion | 19% | 25% | 28% | |
Other statistics about Thornley
| Statistic | Thornley | North East | England and Wales | |
|---|---|---|---|---|
| +/- | ||||
| Annual household income | £23k | £28k | £34k | |
| Domestic gardens | 5% | 2% | 19% | |
| Green spaces | 88% | 91% | 51% | |